
The Look-and-Say Sequence: A Tribute to John Conway
One week ago today, we lost one of the most inspirational mathematicians of this generation. In this post, we take a brief look at the incredible legacy that John Conway left behind. On top of that we will discuss one of the many problems he tackled during his career; one that, to this day, occupies a special place in my heart. We close by discussing an intriguing puzzle that I am yet to find a solution to—can you?

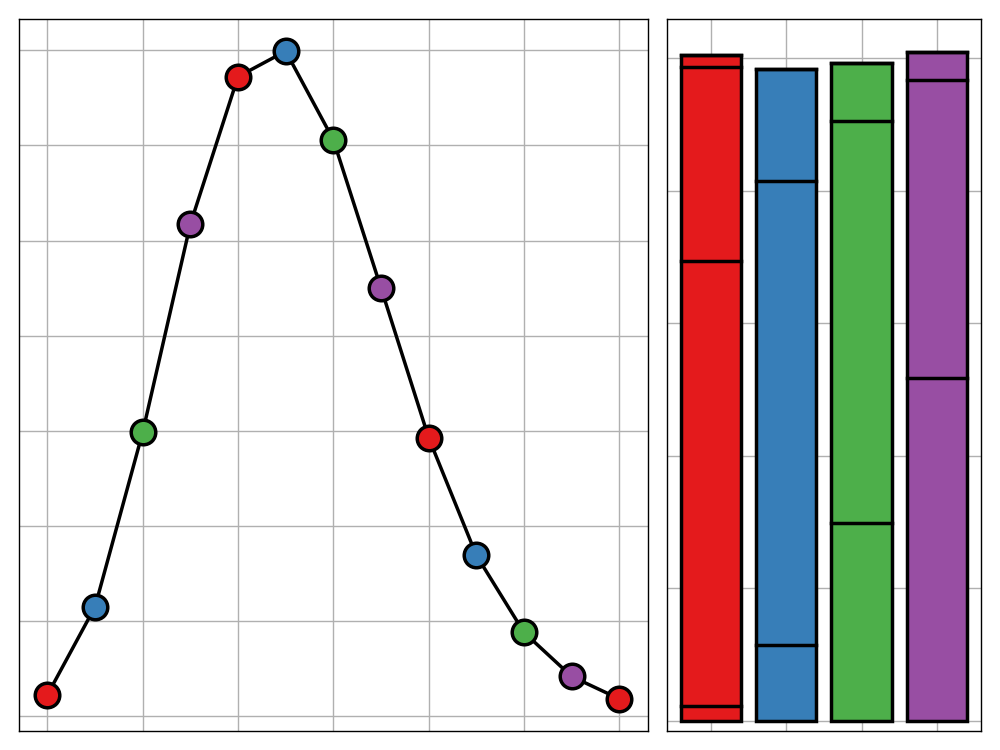
Bank Holiday Bodge: The Sentiment of Shakespeare
As much as we'd like to in order to appear cultured, it is likely that many of us just haven't found the time or motivation to get through the iconic Shakespeare plays we are all familiar with. I don't have a full solution for that, but at the very least, this post presents a way of understanding the general narrative arc of the plays from a quick glance.

Is it Time to Ditch the MNIST Dataset?
The MNIST dataset is the bread and butter of deep learning. Featuring 70,000 handwritten, numerical digits partitioned into a training and testing set, the dataset is the go to candidate for a large proportion of introductory tutorials, benchmarking tests, and data science showcases. This post questions the suitablility of this dataset for such uses, attributing this shortcoming to the excessive simplicity of the challenge it presents when tackled with modern machine learning tools. Additionally, we look at alternatives to the dataset that demonstrate a more appropriate challenge without fundamentally changing the learning problem.

Excel Abuse: Peaceable Queens
Microsoft Excel is a powerful tool for solving problems in many disiplines. It does, however, have its limitations; there are simply some problems that should not be solved in Excel. This is the first post in a new series in which we ignore these shortcomings and push Excel to its limits to solve problems that it was never meant for.

A Statistican's Guide to Love
Struggling to find 'the one'? Perhaps statistics can help. In this post we introduce a pair of simple procedures which—when followed—can optimise your chances of finding love.

An Analysis of Strange Timezones
Timezones are strange things. Be it Chatham Island's 45-minute offset or West Bank's ethnically divided use of daylight saving, it almost seems like the timezones of the world were chosen to baffle. In this post we ask which capital city has a timezone that differs the most from what would be expected given its longtitude. Any guesses?

Bank Holiday Bodge: Daily XKCD Mailer
2020 is here and one of my goals for the coming year is to finally get caught up on the XKCD comic series. Starting from the beginning is a dull way of doing things so instead I've taken advantage of Google Cloud Platform's Cloud Scheduler to setup a python script to email me a random selection of new comics each day. In this post I will share how you can do the same.

Bank Holiday Bodge: Parametric Snowflakes
After yesterday's post drawing Christmas trees with Python, it's time to give R a chance to shine. In this post, I use the shiny and ggvis packages to build a webapp for generating parametric snowflakes.

Bank Holiday Bodge: Coding up Christmas
Christmas is here but that's no excuse to stop coding. In the second installment of the bank holiday bodge series, there will be a major change in format but the principle will stay the same—showcasing a rough piece of work brought to fruition in a single day. This post will concern the use of parametric equations and the animation module from matplotlib to generate your own ornamented Christmas tree animation
#AdventGate—The shocking secret Big Advent doesn't want you to know
Don't waste your tin foil wrapping up your turkey when fashioning it into a hat is far more in need this Christmas. In this post I will reveal how advent calendar makers the world over, have been lying to you about. So launch your VPN and delete your cookies, we're about to take down Big Advent.
Recent