I guess I should have seen this coming, but I still feel rather surprised to be writing another post so soon.
Yesterday, I released a blog post showing how the matplotlib.animation Python module can be used to generate a beautiful Christmas tree animation. Why should Python get all the Christmas love though? Well, to compensate, today’s Bank Holiday Bodge will be written in R using a combination of shiny and ggvis.
For those unfamiliar with the format, as of the start of the 2019/20 academic year, I decided to spend each bank holiday working on a project from scratch, writing a blog post to match and releasing the whole thing on the same day. This has been a real challenge and has pushed my coding and writing efficiency to its limit. On the other hand, I’ve found it highly satisfying to occasionally through out pieces of work that may not be completely polished but are still interesting to me.
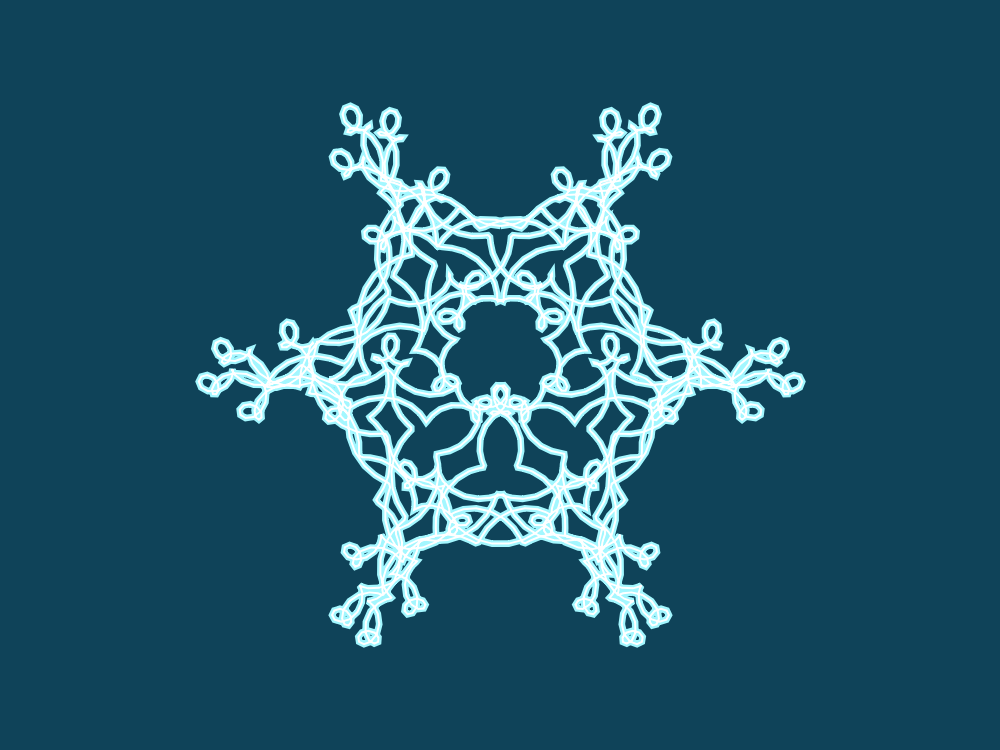
Today’s project was a very short one; I feel bad enough doing any coding on such a family-focused day, but I found time to sneak this one in. The result of my work is a simple web app which allows a user to draw snowflakes by altering three parameters: stretch, twist, and wiggle. Furthermore, the colours used in the drawing as well as the line thickness and length can be controlled. The final product can be found here and the source code is located here
If we let $\alpha$, $\beta$, and $\gamma$ represent stretch, twist, and wiggle respectively, then the parametric equations for a snowflake are given by:
$$
x = \sin\left(\frac{t}{2}\right)-\alpha \sin\left(\beta t\right)\cos\left(t\right)-\frac{\gamma}{10}\sin\left(10\beta t\right) \\
y = \cos\left(\frac{t}{2}\right)-\alpha \sin\left(\beta t\right)\sin\left(t\right)-\frac{\gamma}{10}\cos\left(10\beta t\right) \\
0 \leq t \leq 4 \pi ,, \alpha \in (-1.5, 1.5), , \beta \in {3, 4, \ldots, 15}, , \gamma \in (0, 1.5)
$$
The contents of the code are pretty standard except for the use of ggvis over ggplot2. ggvis is a package still lacking maturity. It was brought into the world many years ago with the hope of replacing ggplot2. The beauty of the package is that it plots directly to a web canvas, making animation and interactivity with the resultant graphics simple to implement and smooth to view. Unfortunately, support for the package has slowly faded and it currently sits in limbo waiting for the right developers to take it where it needs to go. For now, it still has many useful features (although the difficultly of implementing these due to the lack-luster documentation makes it questionable whether it is worth the effort).
I decided to use this package so that I could easier animate between snowflakes when the shape parameters were changed. I am happy with the result although I would have liked to make the transitions smoother if I had time.
Anyway, have a play around and I will see you on New Year’s Day!