
Efficiently Solving a Google Coding Interview Question Using Pure Mathematics
Pure mathematics can get a bad reputation at times for being too abstract, and losing relevance to the real world. I think this reputation is largely unjustified and so, in this post, I show how a knowledge of the pure mathematical topics of linear algebra and combinatorics led me to a blazingly fast, and devilishly simple solution to a Google coding interview question.
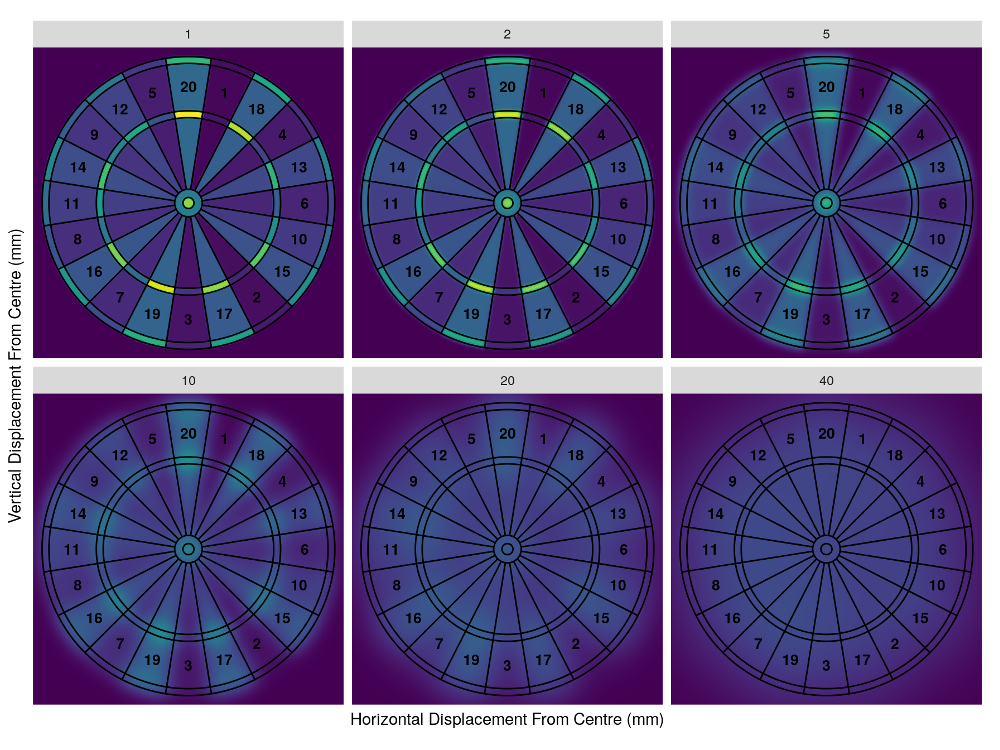
A Statistican's Guide to Playing Darts
Although the game of darts requires a tremendous amount of skill to be a good player, there is still a very large probabilistic element. In this post, we take undertake a stochastic analysis of the game in order to reach an optimum strategy for play depending on the typical accuarcy of your shots.

The Inaccuracy of Accuracy
In a data-driven world, your analyses will only ever be as good as the metric you use to evaluate them. In this post, I make the claim that the de facto metric used in data science is unfit for purpose and and can lead to the construction of unethical models. If this is the case, what should we use instead?
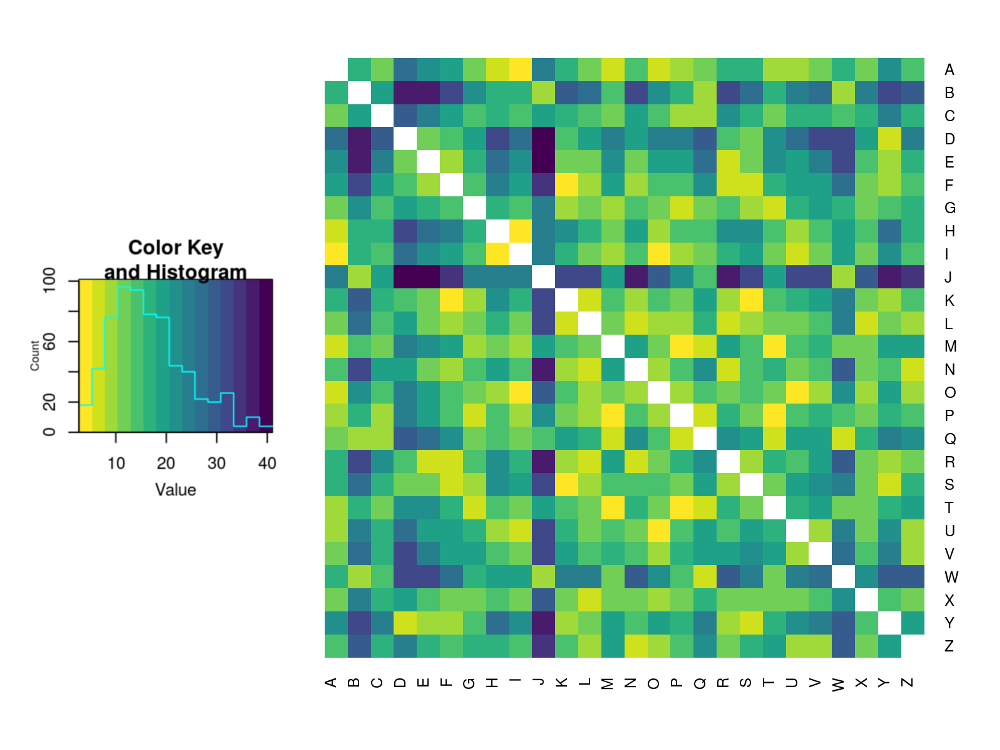
Letter Distributions in the English Language and Their Relations
If you've ever tried to solve a simple cryptography problem, then you may have developed an intuitive sense of where you're most likely to find a letter in a word. For example, 'Q's are rarely at the ends of words whereas 'D's are much more likely to be found there. This post explores this idea and concludes by clustering the letters of the Latin alphabet based on their distributions throughout English words.

Solving Complex Coverage Problems Using Microsoft Excel
Microsoft Excel is an incredibly powerful and easy to use tool for data analysis and OR. In this post, I introduce a highly generalised and complex coverage problem and walk through my solving process; from formulation, to model-building.

Creating a Dynamic 8-Bit Wallpaper for Linux with Python
Your desktop wallpaper may be the one image that you see most often in a given day so its probably worth your time to make it look the best it can. In this post, I offer a template for a dynmically-changing 8-Bit wallpaper which automatically syncs itself to sunrise and sunset times, produced using Python and compatible with Linux.

Integration Tricks using the Exponential Distribution
Not all integrals are created equally. In this post we look at a particular class of integrals which can be highly troublesome to evaluate. Thankfully, probability theory provides us with a framework that allows us to avoid the standard method of evaluation and by doing so makes our working far less error-prone.
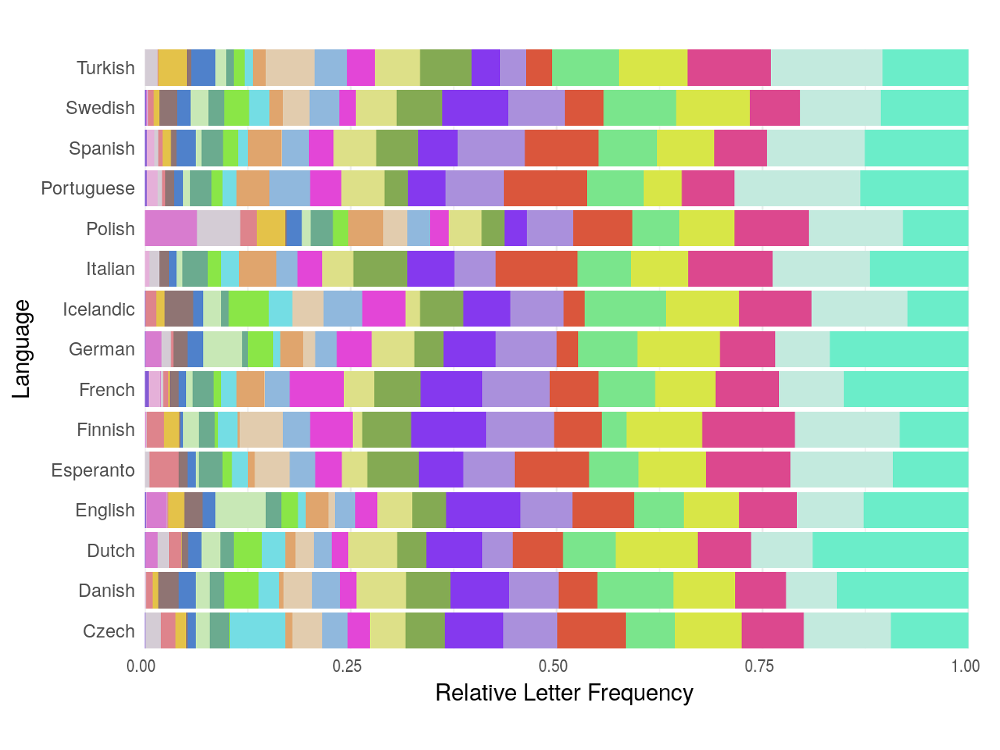
Rethinking the T9 Typing Layout
Using an old number-pad mobile phone to send a text has to be one of the most strenuous and irritating tasks of the first world. In this post - although far too late to be of any use - I attempt to optimise the layout used on these phones to increase typing efficiency for a range of European languages.

Streamlining Your Data Science Workflow With Magrittr
The Tidyverse is here to stay so why not make the most out of it? The `magrittr` package extends the basic piping vocabulary of the core Tidyverse to facilitate the production of more intuitive, readable, and simplistic code. This post aims to be an all encompassing guide to the package and the benefits it provides.

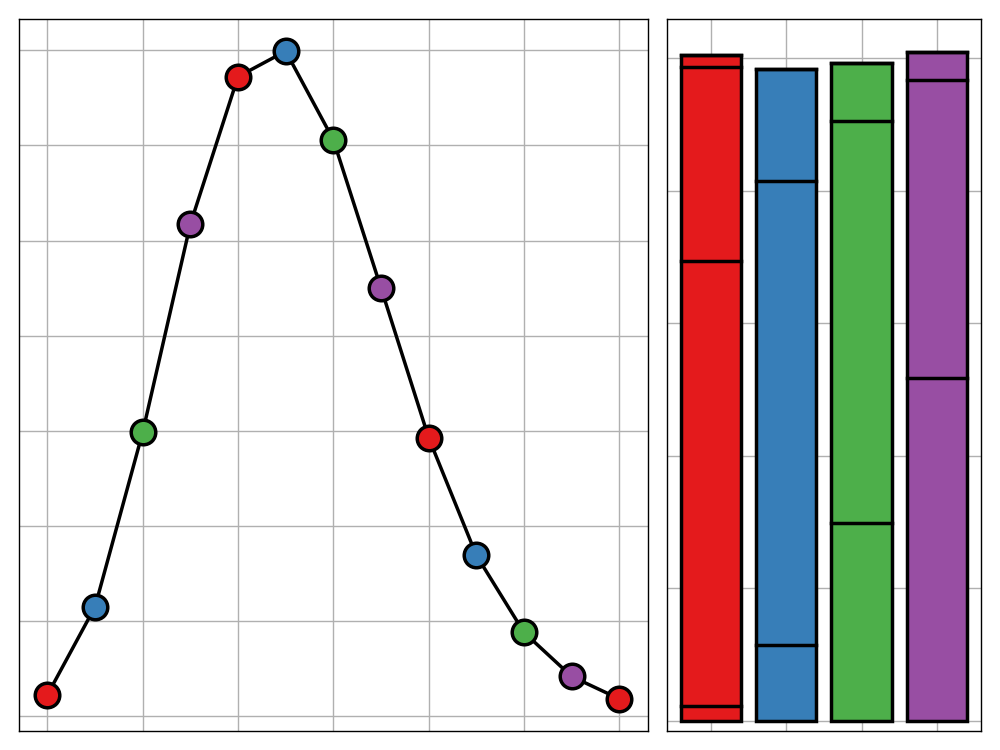
Binomial Recursion
In this post, we take a simple coin-flipping puzzle and through scope-expansion and generalisation, turn it into a monster probability problem that we can be proud to have tackled. In it, we look at some clever techiques for calculating probabilities which are vital in any experienced statistian's toolbox.
Recent