
Streamlining Your Data Science Workflow With Magrittr
The Tidyverse is here to stay so why not make the most out of it? The `magrittr` package extends the basic piping vocabulary of the core Tidyverse to facilitate the production of more intuitive, readable, and simplistic code. This post aims to be an all encompassing guide to the package and the benefits it provides.

Binomial Recursion
In this post, we take a simple coin-flipping puzzle and through scope-expansion and generalisation, turn it into a monster probability problem that we can be proud to have tackled. In it, we look at some clever techiques for calculating probabilities which are vital in any experienced statistian's toolbox.
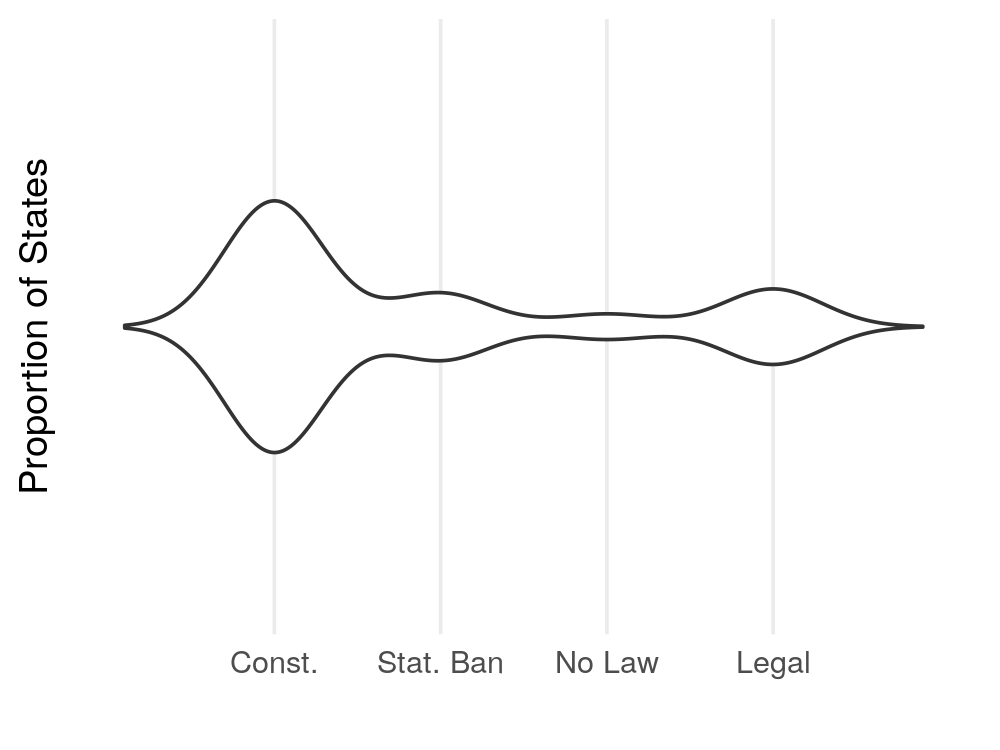
Gloopy Violin Plots
The fourth dimension is often overlooked in data visualisation applications but, in doing so, are we potentially missing out on some more effective ways to present data? In this post, I argue that there are certain use cases where adding a temporal dimension to your visualation greatly improves the clarity of the result in expressing you message. Furthermore, I offer an example of such a visualisation, produced using the `gganimate` package.

Efficiently Removing Zero Variance Columns (An Introduction to Benchmarking)
There are many machine learning algorithms, such as principal component analysis, that will refuse to run when faced with columns of data that have zero variance. There are multiple ways to remove these in R, some much faster than others. In this post, I introduce some such methods and demonstrate how to use the `rbenchmark` package to evaluate their performance.
Recent